How to Create a Bipartite Graph From a Dataframe in Python
A bipartite graph is a type of graph in which the nodes can be divided into two disjoint sets, such that every edge connects a node from one set to a node from the other set.
To create a bipartite graph from a Python DataFrame you can use Pandas and NetworkX libraries.
Method: Use NetworkX Library
import networkx as nx
G = nx.Graph()
G.add_nodes_from(df['column1'].unique())
G.add_nodes_from(df['column2'].unique())
G.add_edges_from(df.values)
nx.draw(G, with_labels=True)
The following example shows how to create bipartite graph from dataframe in python.
Using NetworkX Library
Let’s see how to use NetworkX library to create bipartite graph:
import pandas as pd
import networkx as nx

# Create dataframe
office_stuff = pd.DataFrame({
    'Date':['01-03-2023', '01-03-2023', '01-03-2023', '01-03-2023', '02-03-2023', '02-03-2023'],
    'Product_Code':['A-101', 'A-102', 'A-103', 'B-101', 'B-102', 'B-104'],
    'Product_Name':['Laptop', 'Mobile', 'Printer', 'Keyboard', 'Scanner', 'Mouse'],
    'Price':[4500, 550, 250, 50, 350, 50],
    'Status':[1, 1, 1, 0, 1, 1]})

# Create set
products = set(office_stuff["Product_Code"])
date = set(office_stuff["Date"])

# Create an empty bipartite graph
G = nx.Graph()

# Add nodes
G.add_nodes_from(products, bipartite=0)
G.add_nodes_from(date, bipartite=1)

# Add edges
for index, row in office_stuff.iterrows():
    G.add_edge(row["Product_Code"], row["Date"])

# Plot bipartite graph
pos = nx.bipartite_layout(G, products)
nx.draw_networkx(G, pos=pos)
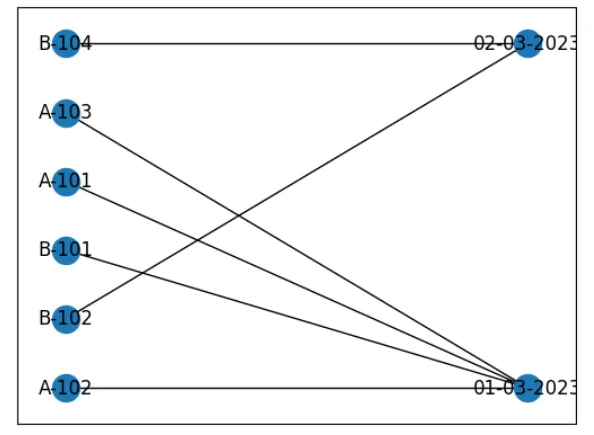
Output:

Here the output shows bipartite graph which created from dataframe.